Panel Types
Wuji Studio provides the following visualization panels:
| Panel type | Description |
|---|---|
| 3D View | Renders hand skeleton, fingertip poses, and more in 3D space (see 3D Hand Visualization) |
| Plot | Displays numerical data as time-series line charts |
| Tactile Matrix | Visualizes tactile sensor data as a color-coded matrix heatmap |
| Raw Messages | Displays Topic raw message content in JSON format with two-frame diff comparison |
| Tab | Groups multiple panels into tabs to save screen space |
Plot
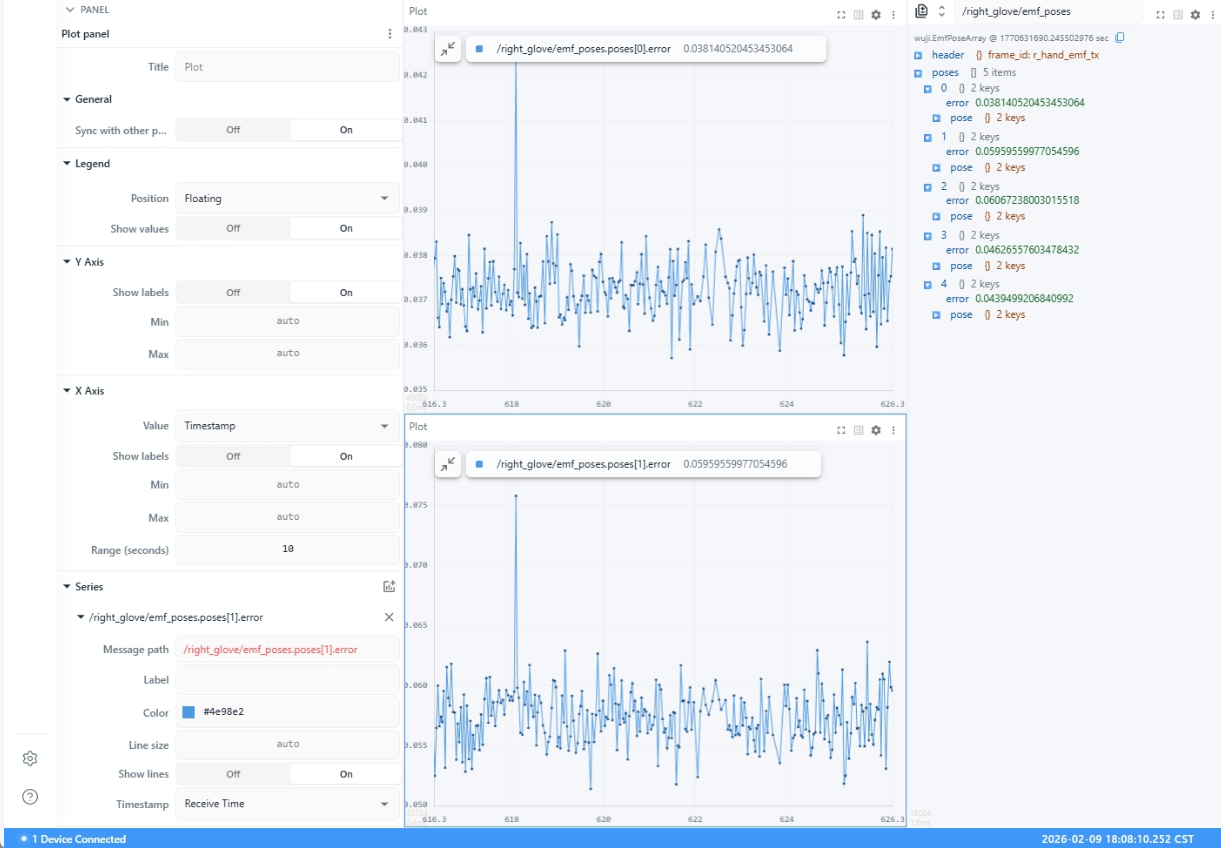
Displays numerical data as time-series line charts.
Tactile Matrix
Visualizes tactile sensor data as a color-coded matrix heatmap.
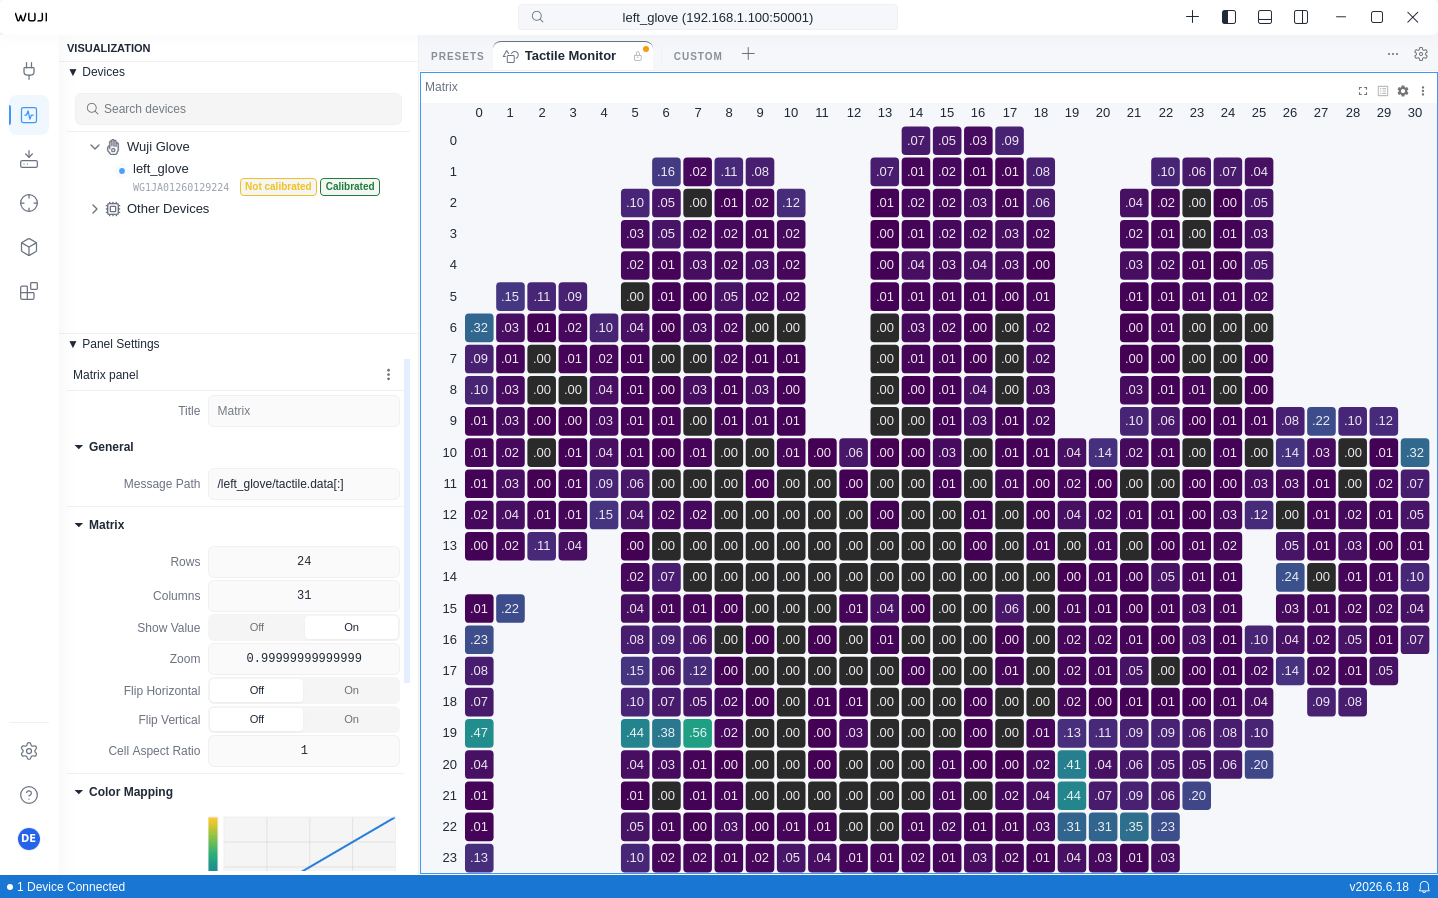
Switch colormaps from the Color Map dropdown in the Sidebar's Panel section. The default is Viridis (perceptually uniform), and Safety (Okabe-Ito) is the accessibility-friendly option.
| Setting | Description |
|---|---|
| Min Value / Max Value | 0.0 ~ 1.0 (normalized) Invalid data points (value -1) are automatically skipped during rendering. |
| Zoom / Flip Horizontal / Flip Vertical | Supports horizontal/vertical flip and zoom |
| Show Value | Display numerical value in each cell |
The tactile sensor matrix is 24 × 31, divided into 6 zones:
| Zone ID | Region | Matrix Size |
|---|---|---|
| 6 | Palm | 14 × 22 |
| 1 | Thumb | 10 × 5 |
| 2 | Index | 9 × 5 |
| 3 | Middle | 10 × 6 |
| 4 | Ring | 9 × 6 |
| 5 | Pinky | 11 × 5 |
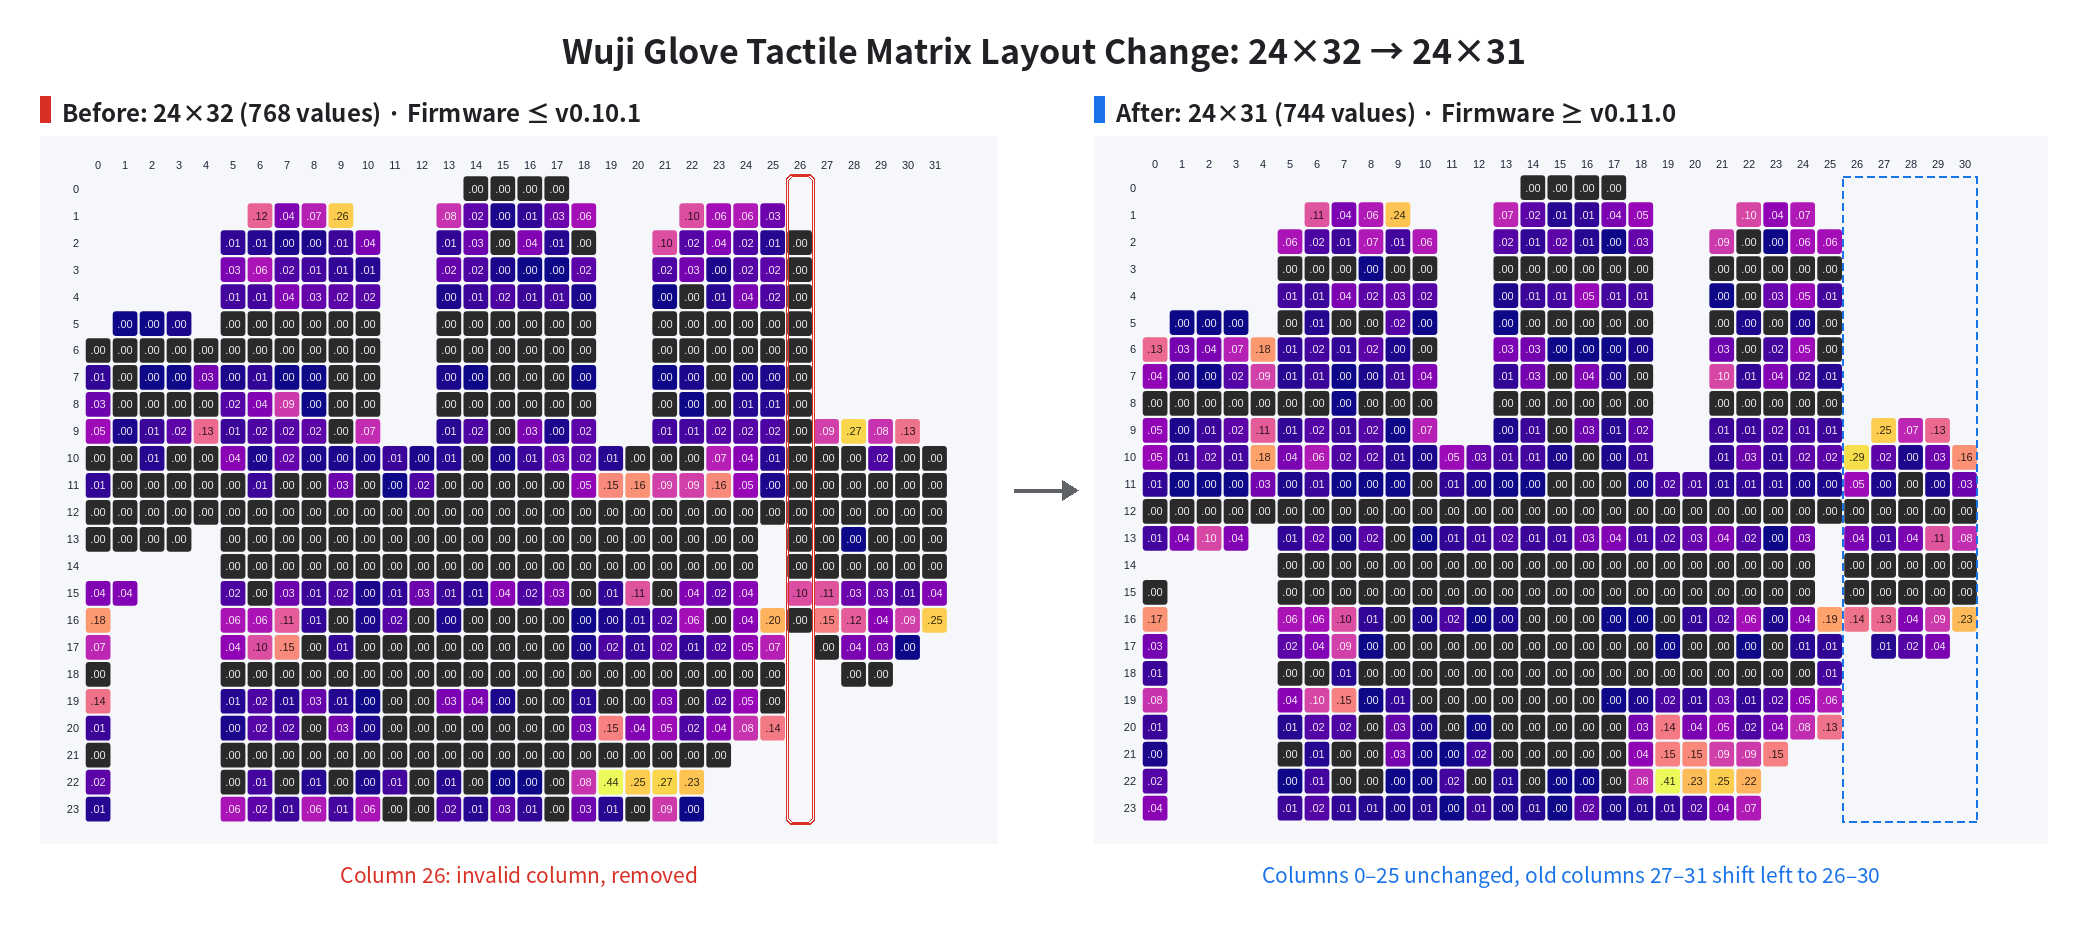
Starting with firmware v0.11.0, the tactile matrix changes from 24×32 (768 values) to 24×31 (744 values), removing invalid column 26 from the 24×32 layout. The remaining columns keep their relative order: columns 0–25 keep their indices, and columns 27–31 shift left to become columns 26–30.