Overview
The Visualization View is the core workspace of Wuji Studio. After connecting a device, real-time data publishes through Topics. Use different panel types to view and analyze data.
Enter Visualization
After connecting a device on the Device Management page, an Enter Visualization button appears in the Bottom action area. Click it to switch to the Visualization View and start viewing real-time data. You can also click the Visualization icon in the Activity bar directly.
Visualization View Overview
The four areas of the Visualization View are outlined in different colors. The table below covers what each area does and how to open or collapse it. The Panel area outlined in is the default layout. To restore the default layout after changing it, right-click the current preset tab in the preset bar at the top (Tactile Monitor in the image below) and select Reset to Default. See Troubleshooting > Restore the default layout.
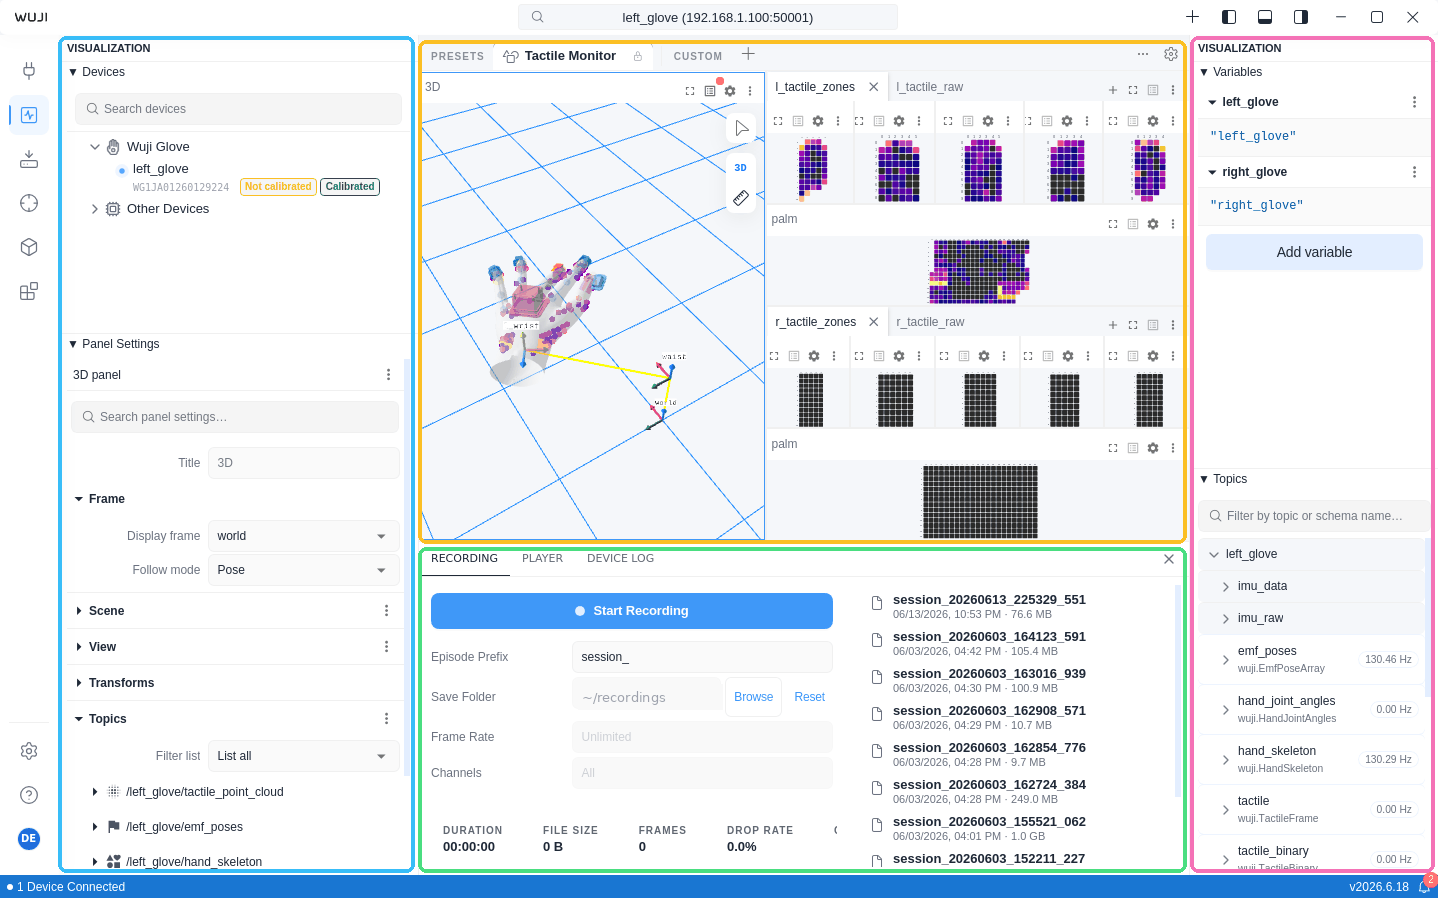
The Visualization View consists of the following areas:
| Area | How to Open | Description |
|---|---|---|
| Left Sidebar | Click the icon in the top-right corner to expand the area | The left sidebar contains 2 panels:
|
| Panel area | The area is always visible | Data visualization workspace with free drag-and-drop and split-view layout:
|
| Right Sidebar | Click the icon in the top-right corner to expand the area | The right sidebar contains 2 panels:
|
| Bottom bar | Click the icon in the top-right corner to expand the area | Collapsed by default. Contains 3 tabs:
|
Topic Tree
The Topics panel in the Right Sidebar displays all available data Topics. Topics are organized in a tree structure separated by / namespaces. When expanded, schema fields are shown hierarchically (separated by .), with support for array and struct nesting. Click a Topic to view its details, or drag it into a panel to subscribe to data.