Plot
Displays numerical data as time-series line charts.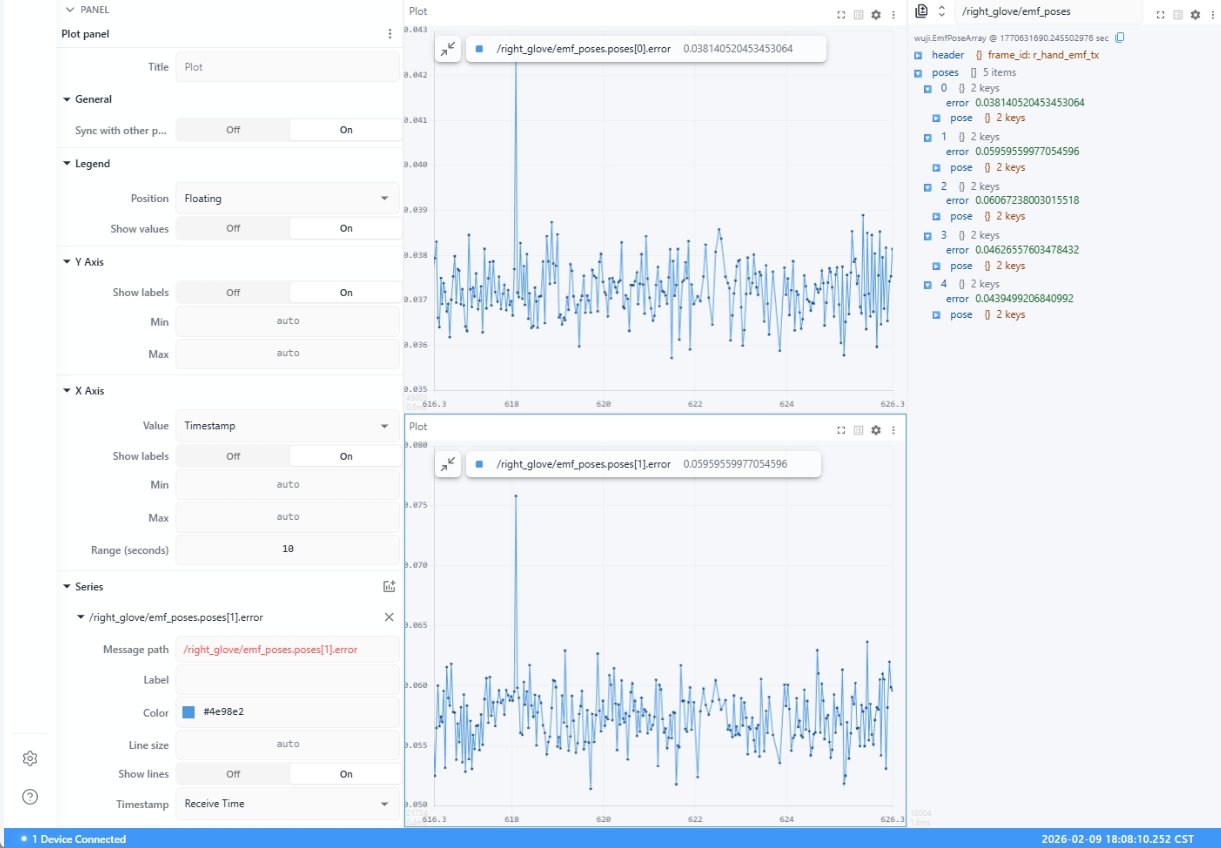
Tactile Matrix
Visualizes tactile sensor data as a color-coded matrix heatmap.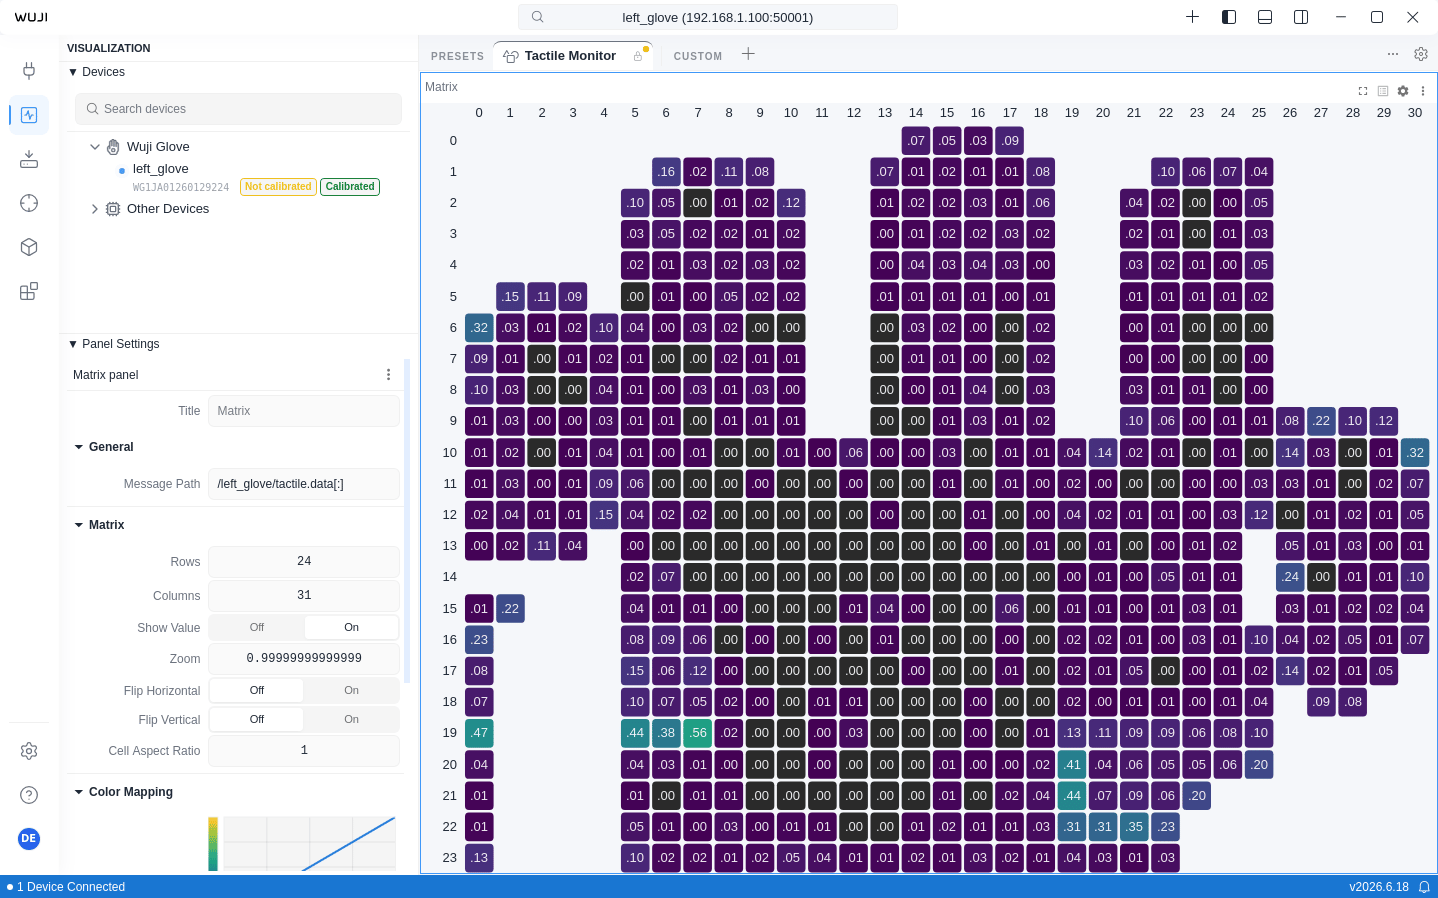
The tactile sensor matrix is 24 × 31, divided into 6 zones:
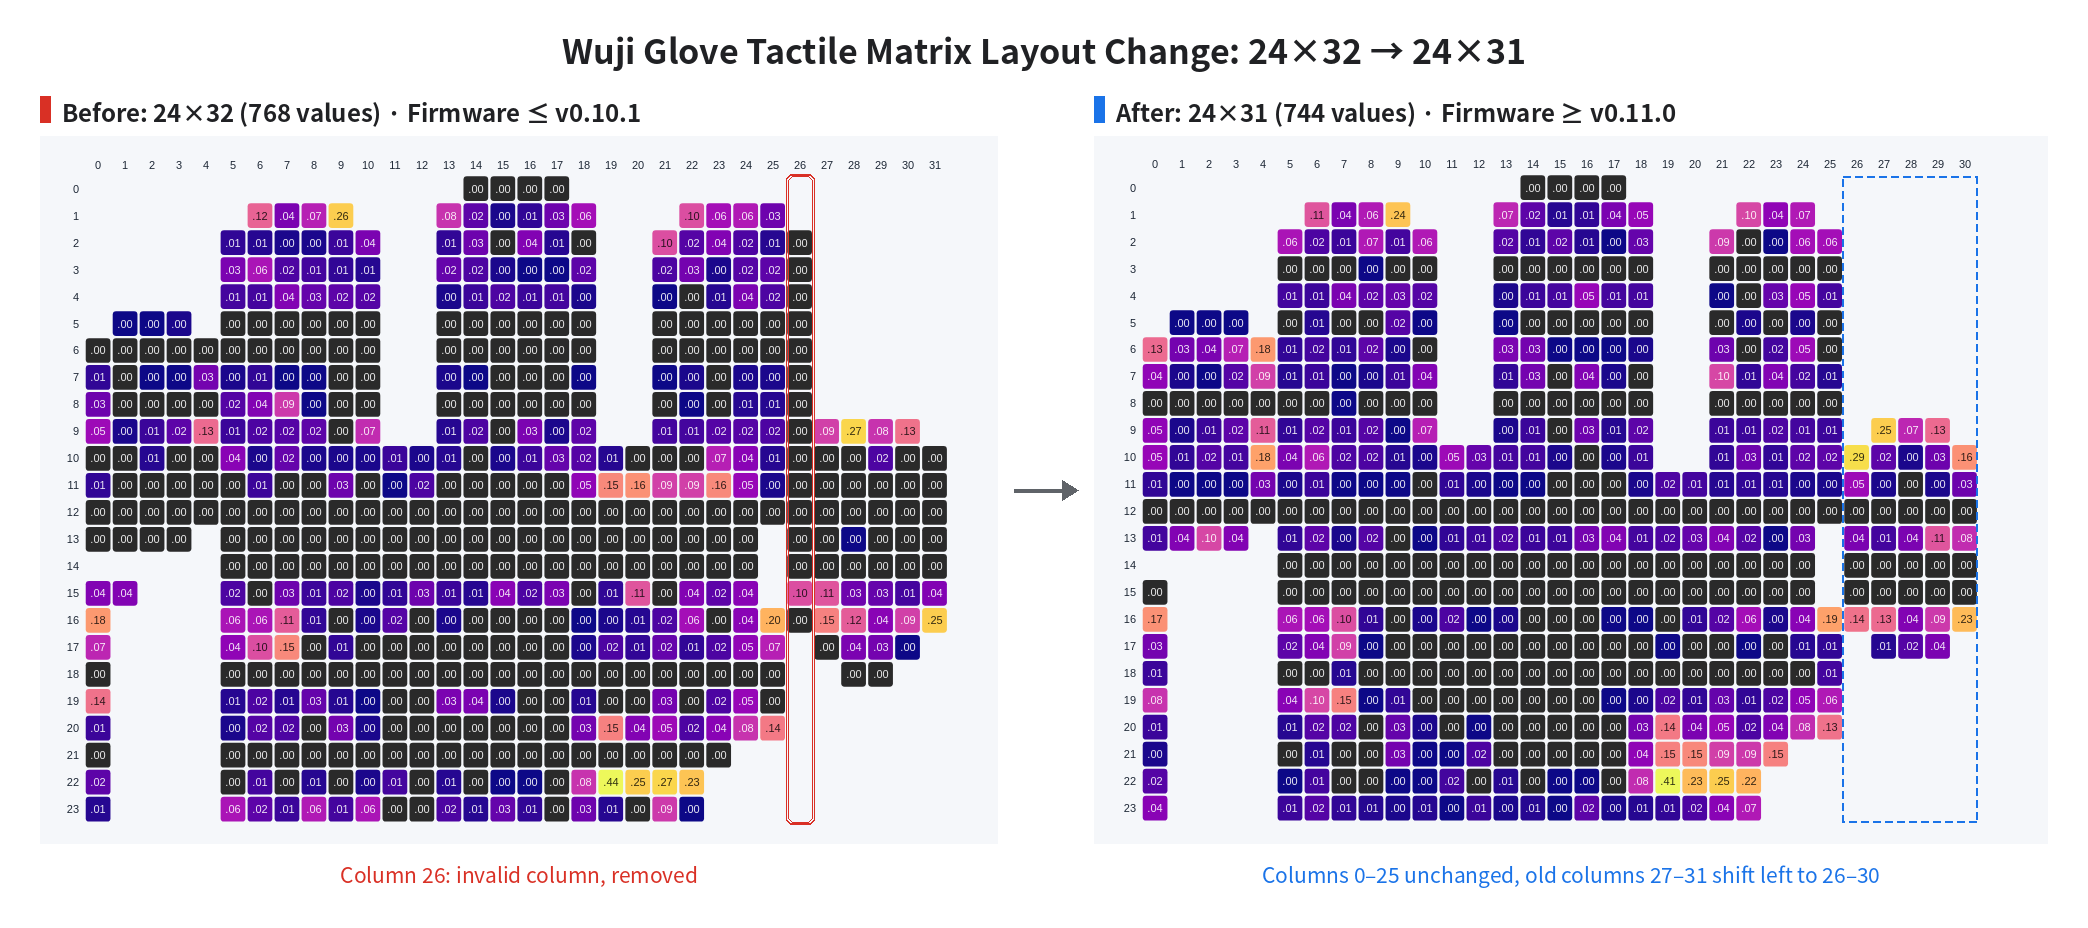
Starting with firmware v0.11.0, the tactile matrix changes from 24×32 (768 values) to 24×31 (744 values), removing invalid column 26 from the 24×32 layout. The remaining columns keep their relative order: columns 0–25 keep their indices, and columns 27–31 shift left to become columns 26–30.