> ## Documentation Index
> Fetch the complete documentation index at: https://docs.wuji.tech/llms.txt
> Use this file to discover all available pages before exploring further.
# Device Logs
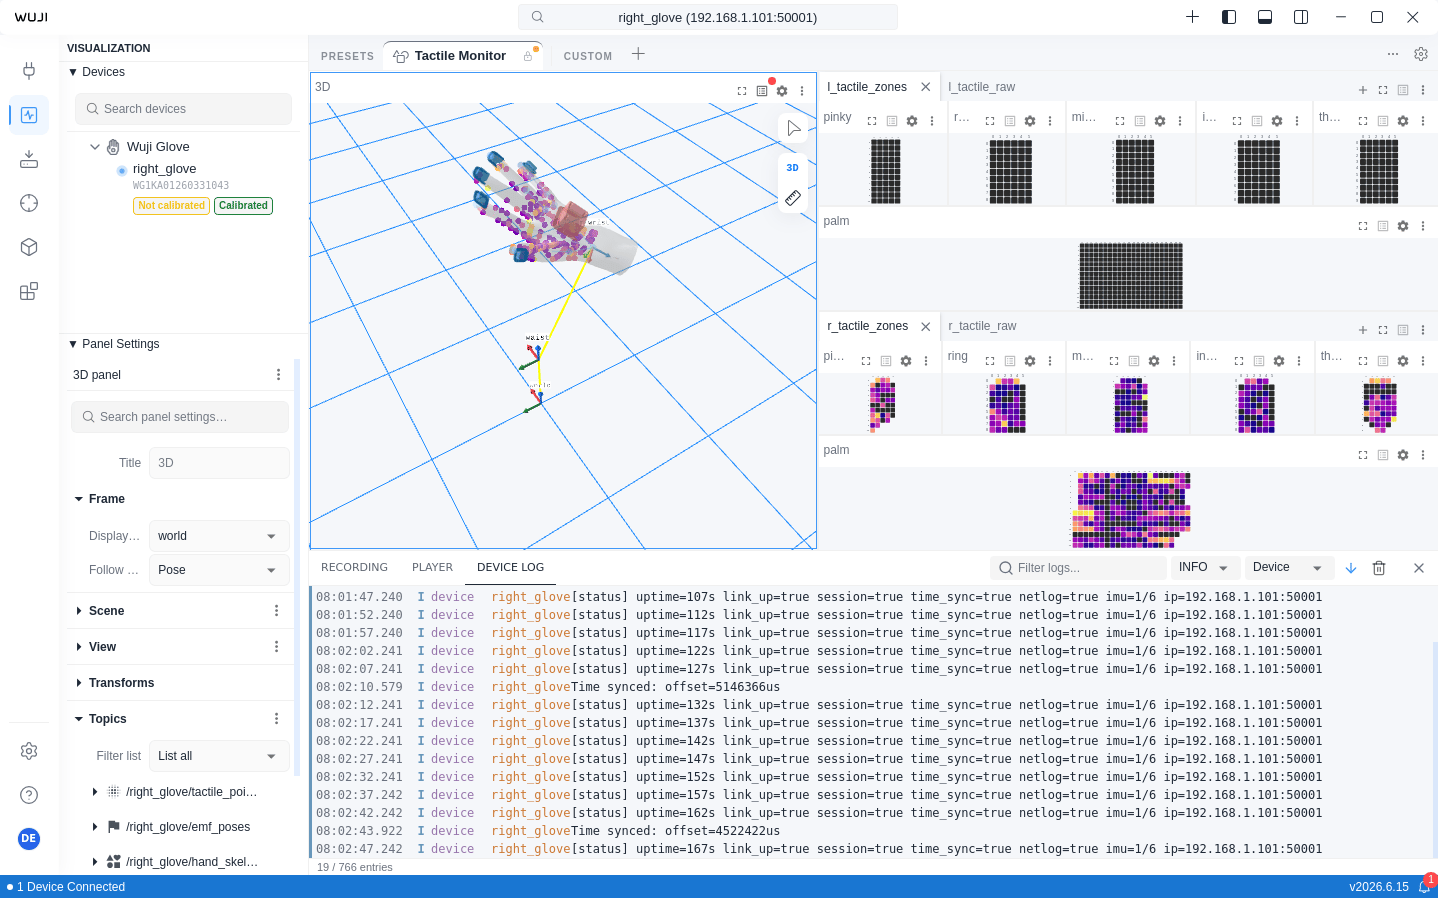
On the [Visualization](/en/docs/wuji-studio/visualization) page, click the **Show bottom bar** icon in the top-right corner to expand the Bottom bar, then switch to the **DEVICE LOG** tab to view real-time logs from the device and software for troubleshooting.
## Toolbar
| Control | Function |
| - | - |
| Filter logs | Keyword search across message content, level, source, and device name. The panel footer shows a "filtered / total" entry count (such as "42 / 100 entries") |
| Log Level | Filter by severity, showing logs at or above the selected level:
**TRACE**: most detailed tracing information
**DEBUG**: debugging information
**INFO**: general runtime information (default)
**WARN**: warning messages
**ERROR**: error messages
|
| Source | Multi-select filter for log sources:
**Device**: firmware runtime logs from the device (enabled by default)
**SDK**: Wuji SDK runtime logs (disabled by default)
**Studio**: Wuji Studio application logs (disabled by default)
|
| Auto-scroll | When enabled, scrolls to the bottom as new logs arrive. When disabled, lets you browse log history freely |
| Clear | Clears all current log entries |
## Local Log Files
The log panel does not provide an export button. All logs persist to `~/.wuji/logs/` and roll over daily:
| File | Content and Use |
| - | - |
| studio\_YYYY-MM-DD.log | Combined runtime logs for the Studio app, SDK, and connected devices, identical to what the log panel displays. Messages from all three sources (Device, SDK, Studio) end up here. Share this file for everyday troubleshooting |
| sdk\_YYYY-MM-DD.log | Wuji SDK's own runtime logs. When used inside Studio, SDK content is also bridged into `studio_*.log`. When running the SDK standalone (such as Python package scripts) without Studio, this file is the only SDK log source |
| device\_YYYY-MM-DD.bin | Raw binary dump of communication data between the device and Studio. Not human-readable. Used to replay protocol frames or pinpoint a communication issue |
| stderr\_YYYY-MM-DD.log | The process's standard error output, capturing Rust panics and error messages written by third-party libraries. The file is typically small and only contains data when a crash or low-level exception occurs |
When no device logs are being produced, the panel shows a "Waiting for log messages..." status. Ensure the device is connected and running normally.
This documentation is built and hosted on [Mintlify](https://mintlify.com), a developer documentation platform.
 ## Toolbar
| Control | Function |
| - | - |
| Filter logs | Keyword search across message content, level, source, and device name. The panel footer shows a "filtered / total" entry count (such as "42 / 100 entries") |
| Log Level | Filter by severity, showing logs at or above the selected level:
## Toolbar
| Control | Function |
| - | - |
| Filter logs | Keyword search across message content, level, source, and device name. The panel footer shows a "filtered / total" entry count (such as "42 / 100 entries") |
| Log Level | Filter by severity, showing logs at or above the selected level: